Maui weather in short
The National Weather Service in Honolulu describes two seasons: a "summer" from May to October and a "winter" from October to April. The strongest rain comes with winter storms between October and April. Northeast trade winds blow most of the time, but in winter fronts, cyclones and Kona storms can interrupt them.
The sea stays warm all year. It is coolest at 73 to 74°F (23°C) in late February and March and warmest at nearly 80°F (27°C) in late September and early October. The figures below are NOAA normals for 1991 to 2020. They are averages, not forecasts, so check the daily forecast before you go.
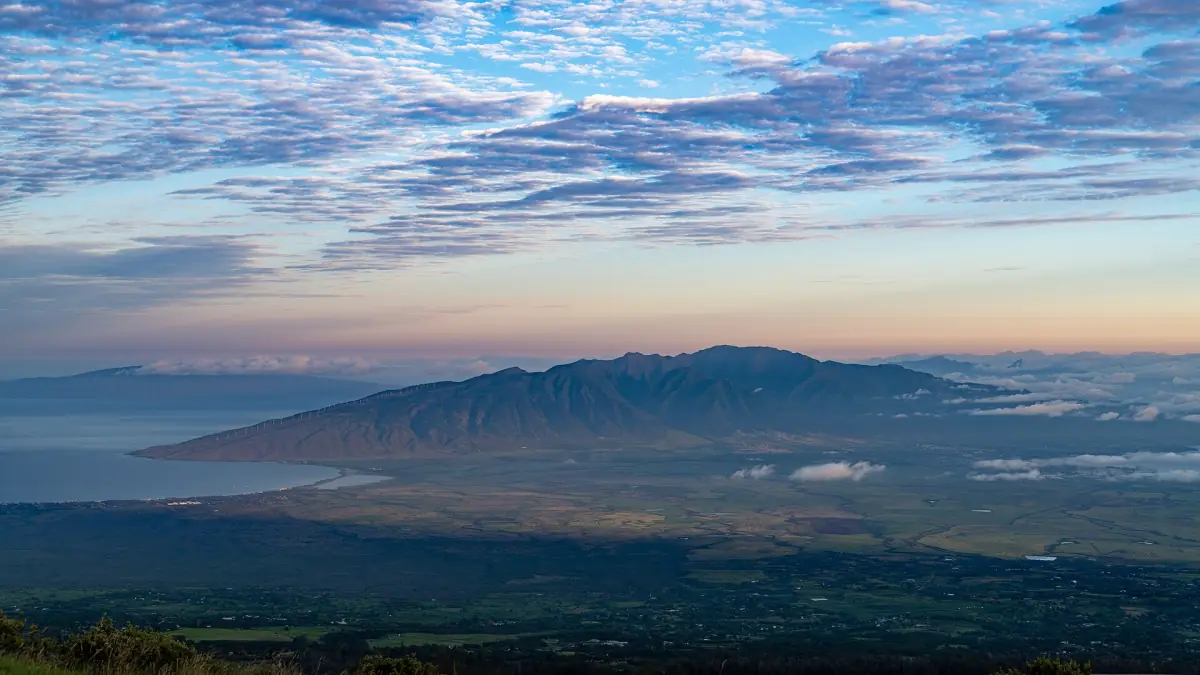
Five places, five climates
Distances on Maui are short, but the weather changes a lot between them.
Kahului and the isthmus
Dry and warm. Kahului airport gets about 16 inches (412 mm) of rain a year, with June the driest month at 0.17 inches (4 mm).
West Maui
Wetter and slightly cooler than the south coast. The Kapalua station records about 28 inches (705 mm) a year, mostly from November to March.
South Maui
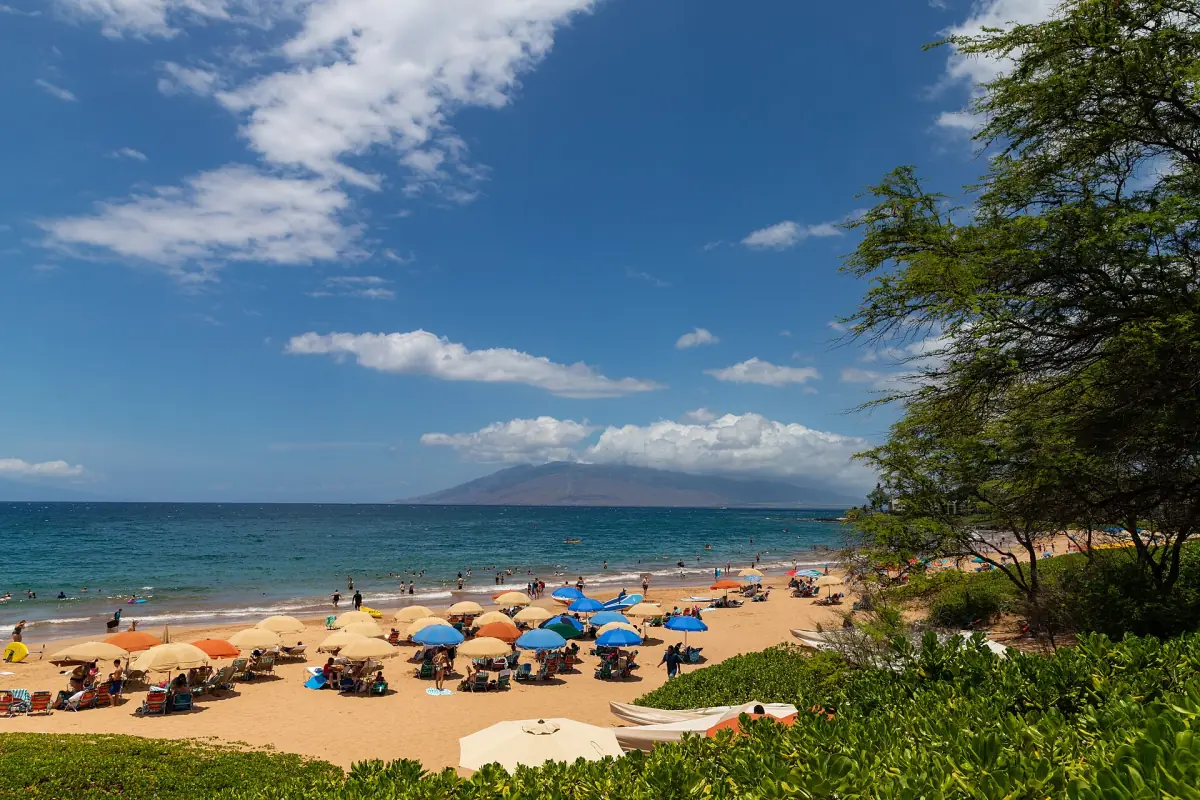
The driest area, and the usual choice for beach days. The Kīhei station records about 11 inches (275 mm) a year, and June has almost no rain.
Haleakalā and Hāna
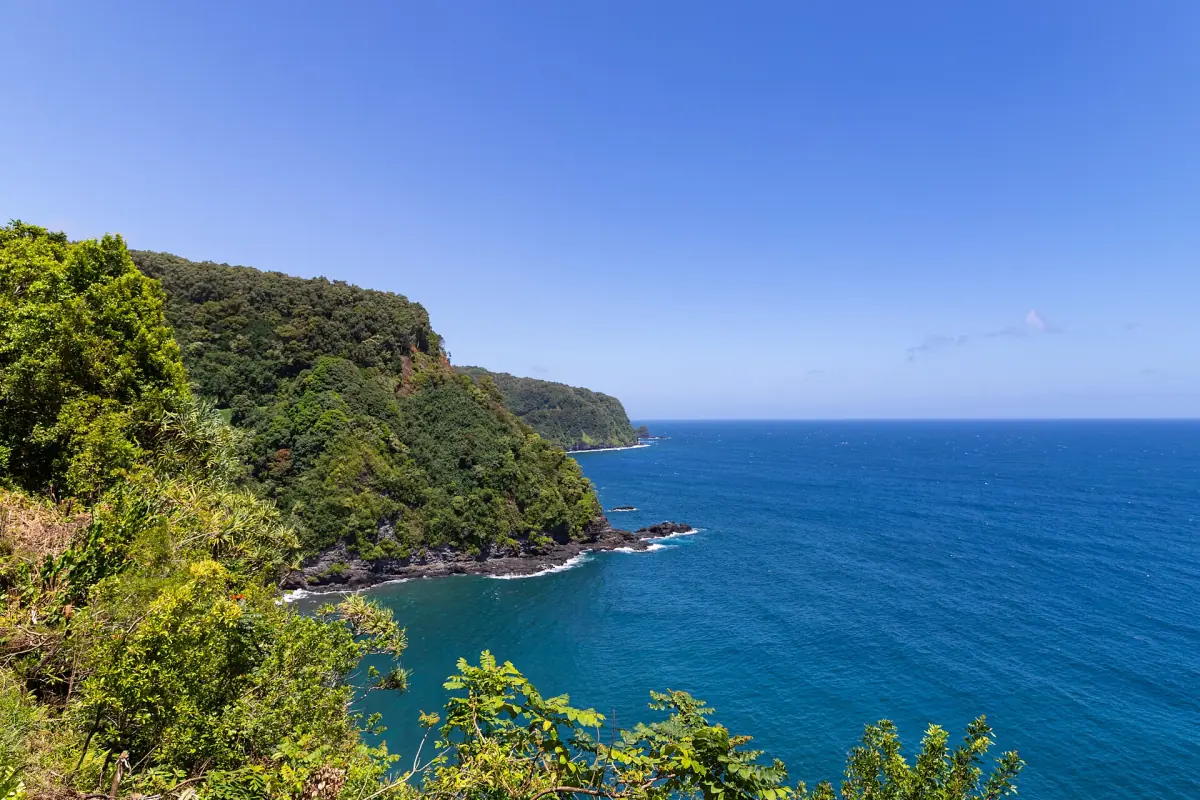
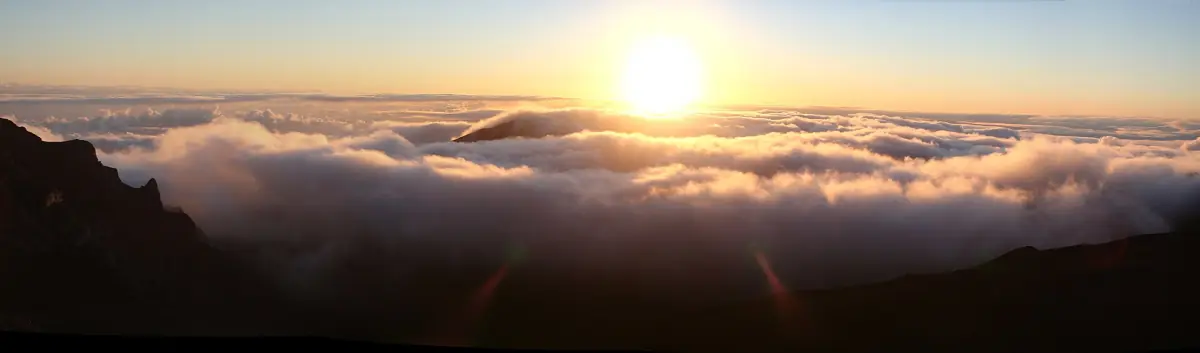
The slopes are cool and fairly wet, and Hāna is wet in every month. Plan for rain, and for cold at the summit.
Maui tours and activities
Snorkel cruises, whale watching, sunrise trips and the Road to Hāna, with live prices and availability.
Monthly temperatures and rain
NOAA climate normals 1991 to 2020. Temperatures in °F with °C in brackets, rain in inches with millimeters in brackets.
Kahului (airport)
Station USW00022516 at 15.5 m. Yearly rain: 16.2 in (412 mm).
| Month | High °F (°C) | Low °F (°C) | Rain in (mm) |
|---|---|---|---|
| Jan | 82.2 (27.9) | 63.6 (17.6) | 2.42 (61) |
| Feb | 82.2 (27.9) | 63.8 (17.7) | 2.00 (51) |
| Mar | 82.9 (28.3) | 65.1 (18.4) | 2.64 (67) |
| Apr | 84.5 (29.2) | 66.6 (19.2) | 1.32 (34) |
| May | 86.5 (30.3) | 67.7 (19.8) | 0.71 (18) |
| Jun | 88.3 (31.3) | 70.3 (21.3) | 0.17 (4) |
| Jul | 89.2 (31.8) | 71.8 (22.1) | 0.53 (13) |
| Aug | 89.9 (32.2) | 72.3 (22.4) | 0.53 (13) |
| Sep | 90.0 (32.2) | 71.2 (21.8) | 0.45 (11) |
| Oct | 88.7 (31.5) | 70.1 (21.2) | 0.83 (21) |
| Nov | 85.8 (29.9) | 68.4 (20.2) | 1.81 (46) |
| Dec | 83.3 (28.5) | 65.9 (18.8) | 2.80 (71) |
West Maui (Kapalua)
Kapalua-West Maui Airport station at 73 m. NOAA has no normals for Lahaina itself, so use this as an approximation for Kāʻanapali and Lahaina. Yearly rain: 27.8 in (705 mm).
| Month | High °F (°C) | Low °F (°C) | Rain in (mm) |
|---|---|---|---|
| Jan | 79.0 (26.1) | 65.7 (18.7) | 3.51 (89) |
| Feb | 79.0 (26.1) | 65.8 (18.8) | 2.43 (62) |
| Mar | 79.4 (26.3) | 66.1 (18.9) | 3.92 (100) |
| Apr | 81.0 (27.2) | 67.5 (19.7) | 2.22 (56) |
| May | 83.0 (28.3) | 68.8 (20.4) | 1.49 (38) |
| Jun | 85.0 (29.4) | 70.4 (21.3) | 1.07 (27) |
| Jul | 85.8 (29.9) | 71.5 (21.9) | 1.58 (40) |
| Aug | 86.2 (30.1) | 72.1 (22.3) | 1.37 (35) |
| Sep | 86.6 (30.3) | 72.0 (22.2) | 1.22 (31) |
| Oct | 85.1 (29.5) | 71.4 (21.9) | 2.23 (57) |
| Nov | 82.0 (27.8) | 69.7 (20.9) | 2.88 (73) |
| Dec | 79.8 (26.6) | 67.6 (19.8) | 3.85 (98) |
South Maui (Mākena)
Mākena Golf Course station at 27 m, an approximation for Wailea and Mākena. Yearly rain: 15.7 in (399 mm). The Kīhei station, which records rain only, averages 10.8 in (275 mm) a year, from 0.02 in (about 0.5 mm) in June to 2.31 in (59 mm) in January.
| Month | High °F (°C) | Low °F (°C) | Rain in (mm) |
|---|---|---|---|
| Jan | 80.1 (26.7) | 63.5 (17.5) | 2.48 (63) |
| Feb | 79.9 (26.6) | 63.0 (17.2) | 1.28 (33) |
| Mar | 81.2 (27.3) | 63.5 (17.5) | 1.99 (51) |
| Apr | 83.1 (28.4) | 64.5 (18.1) | 0.75 (19) |
| May | 84.3 (29.1) | 65.8 (18.8) | 1.08 (27) |
| Jun | 85.9 (29.9) | 67.8 (19.9) | 0.39 (10) |
| Jul | 87.1 (30.6) | 69.1 (20.6) | 0.77 (20) |
| Aug | 87.3 (30.7) | 69.2 (20.7) | 1.21 (31) |
| Sep | 86.8 (30.4) | 69.1 (20.6) | 1.11 (28) |
| Oct | 86.1 (30.1) | 68.4 (20.2) | 1.55 (39) |
| Nov | 83.4 (28.6) | 66.9 (19.4) | 1.24 (31) |
| Dec | 81.2 (27.3) | 64.8 (18.2) | 1.85 (47) |
Haleakalā Ranger Station
This station sits at 2,122 m (6,962 ft), well below the 3,055 m summit, which is colder still. Yearly rain: 42.2 in (1,073 mm). The National Park Service gives summit highs of 50 to 65°F (10 to 18°C) with frost possible in any season.
| Month | High °F (°C) | Low °F (°C) | Rain in (mm) |
|---|---|---|---|
| Jan | 61.0 (16.1) | 43.9 (6.6) | 5.14 (131) |
| Feb | 59.7 (15.4) | 42.7 (5.9) | 4.08 (104) |
| Mar | 59.7 (15.4) | 43.1 (6.2) | 5.70 (145) |
| Apr | 60.7 (15.9) | 43.8 (6.6) | 2.75 (70) |
| May | 63.2 (17.3) | 45.9 (7.7) | 2.44 (62) |
| Jun | 65.6 (18.7) | 47.7 (8.7) | 1.62 (41) |
| Jul | 65.5 (18.6) | 48.9 (9.4) | 2.70 (69) |
| Aug | 66.1 (18.9) | 49.4 (9.7) | 2.17 (55) |
| Sep | 64.7 (18.2) | 47.9 (8.8) | 2.53 (64) |
| Oct | 64.0 (17.8) | 47.8 (8.8) | 3.25 (83) |
| Nov | 63.1 (17.3) | 47.0 (8.3) | 4.59 (117) |
| Dec | 61.1 (16.2) | 45.1 (7.3) | 5.28 (134) |
Hāna (airport)
Hāna airport station at 23 m, an approximation for the east coast. Yearly rain: 72.2 in (1,833 mm).
| Month | High °F (°C) | Low °F (°C) | Rain in (mm) |
|---|---|---|---|
| Jan | 77.8 (25.4) | 64.8 (18.2) | 5.64 (143) |
| Feb | 77.3 (25.2) | 65.0 (18.3) | 5.45 (138) |
| Mar | 77.5 (25.3) | 65.7 (18.7) | 8.46 (215) |
| Apr | 78.2 (25.7) | 67.4 (19.7) | 5.00 (127) |
| May | 79.7 (26.5) | 68.4 (20.2) | 5.43 (138) |
| Jun | 81.1 (27.3) | 69.8 (21.0) | 4.45 (113) |
| Jul | 81.7 (27.6) | 71.2 (21.8) | 5.49 (139) |
| Aug | 82.9 (28.3) | 71.7 (22.1) | 5.99 (152) |
| Sep | 82.5 (28.1) | 70.3 (21.3) | 6.12 (155) |
| Oct | 81.9 (27.7) | 70.5 (21.4) | 6.88 (175) |
| Nov | 80.2 (26.8) | 69.8 (21.0) | 6.65 (169) |
| Dec | 78.8 (26.0) | 68.0 (20.0) | 6.59 (167) |
What the numbers mean for your plans
Choose the place for the activity, then the month.
| Plan | What to look at | Notes |
|---|---|---|
| Beach days | South Maui | The south coast is the driest, and Kīhei gets under 0.8 inches (20 mm) a month from April to October. |
| Road to Hāna | Hāna | Rain in every month, with March the wettest at 8.46 in (215 mm). |
| Haleakalā sunrise | Summit | Cold in every season, so bring warm layers whatever the coast feels like. |
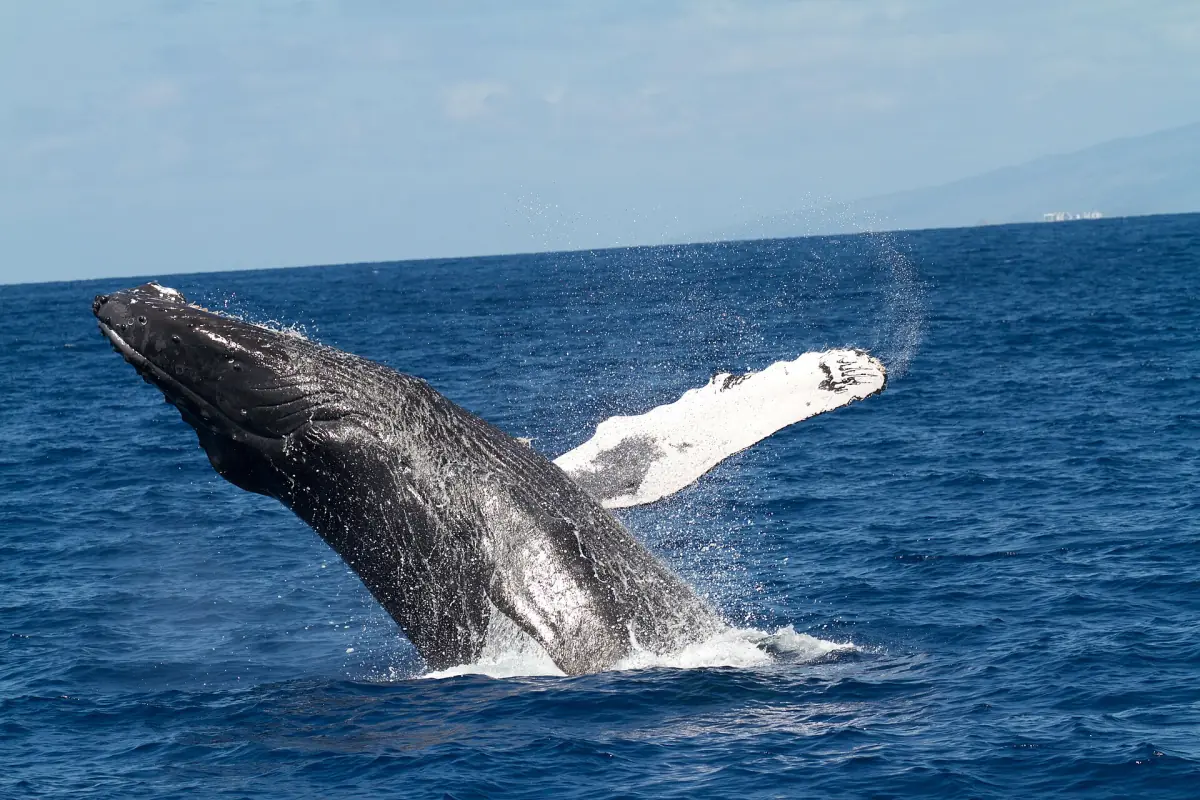
| Whale watching | January to March | NOAA names the peak, and the season runs from November to May. |
| Winter storms | October to April | The strongest rain falls in these months, brought by winter storms. |
Hurricane season 2026
The central Pacific season runs from 1 June to 30 November. For 2026 NOAA expected a 70 percent chance of an above-normal season, with 5 to 13 tropical storms against an average of 4 to 5, and named El Niño as the reason. By 14 October 2026 it had counted 6 named storms, 5 hurricanes and 3 major hurricanes.
Several storms passed south of the islands. Local press reported that Hurricane Nolo in late September left thousands of households in West Maui and Upcountry without power. Flights can be disrupted statewide when a storm passes, so take travel insurance, keep your plans flexible and follow the National Weather Service forecast. Rain can also close roads, and the Road to Hāna is the first place to check.
Plan the rest of your trip
Weather is one piece of it.
Maui weather: frequently asked questions
What is the driest part of Maui?
The south coast. The Kīhei station records about 11 inches (275 mm) a year, and Mākena about 16 inches (399 mm), compared with 72 inches (1,833 mm) in Hāna.
When is hurricane season on Maui?
The central Pacific hurricane season runs from 1 June to 30 November. NOAA expected an above-normal season in 2026.
How warm is the ocean?
Between 73 to 74°F (23°C) in late February and March and nearly 80°F (27°C) in late September and early October, according to the National Weather Service.
How cold is it at the Haleakalā summit?
Highs of 50 to 65°F (10 to 18°C) and frost possible in any season, about 30°F (17°C) cooler than the coast.
When can I see whales?
NOAA gives November to May, with the peak from January to March. Other sources give slightly different start and end dates.